Tool
Microcharts
Tiny chart components for dashboards and dense UI.
About
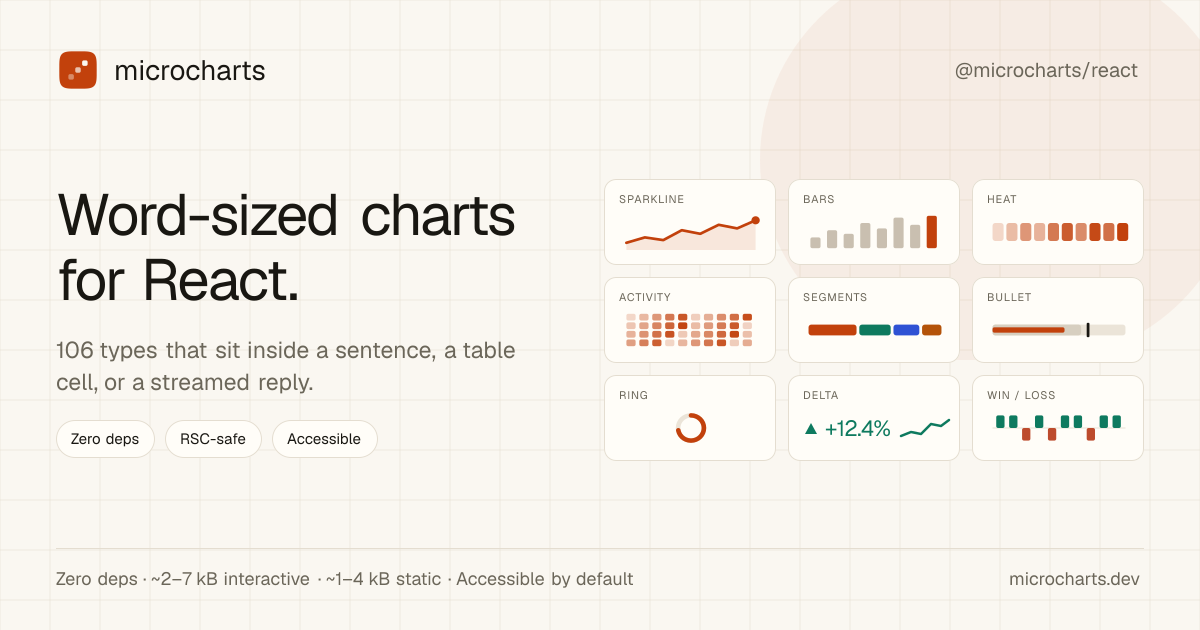
The chart up there is a React component. Pass it an array and that’s the whole setup.
Checkout latency held at 141 ms Checkout p95 latency, weekly, milliseconds through the release window.
A reader shouldn’t have to leave the sentence to understand the number. Here are thirteen weeks of bookings as a line Bookings by week , as bars Bookings by week and as a spread Spread of weekly bookings — the same components the rest of this page uses, set like words .
Pass data and you get something correct. After that, domain , color and title mean the same thing in every chart. The catalog is typed, so an editor or an agent completes it without guessing.
Features
- 4.87 kB 5.21 kB 6.03 kB 6.98 kB
- 0 dependencies
- arrow keys, one tab stop
- name generated from data
- Pricing
- Free
- Pricing detail
- Free chart components
- Platforms
- Web
Alternatives from our catalog
Tools on the same shelves as Microcharts, ordered by shared tags and our own comparisons. Not vendor endorsements.
- ApexChartsOpen Source · JS React Vue Angular
Feature-rich interactivity for apps
same tags
- Observable PlotOpen Source · JS
Journalism default for ggplot-like JS
same tags
- NivoOpen Source · React
Design-forward React dashboards
same tags
- visxOpen Source · React
Bespoke React viz composition
same tags
- DatawrapperFreemium · Web
Reporter favorite for editorial charts
same tags
- FlourishFreemium · Web
Non-dev storytelling viz
same tags
Add a badge to your site
Makers listed on isthereanytool.app can embed this badge. It links to Microcharts’s page on our catalog — no scripts, just HTML.

<a href="https://www.isthereanytool.app/tool/microcharts" target="_blank" rel="noopener"><img src="https://www.isthereanytool.app/badge/listed.svg?theme=paper" alt="Featured on isthereanytool.app" width="250" height="54"></a>