Tool
Plotly.js
Interactive scientific financial charts
About
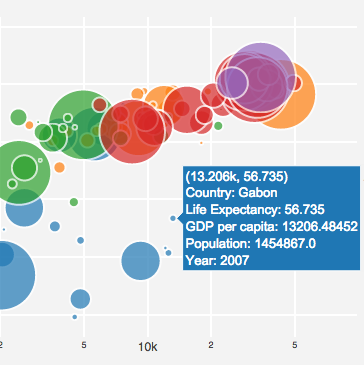
Built on top of d3.js and stack.gl , Plotly.js is a high-level, declarative JavaScript charting library. plotly.js ships with over 40 chart types, including 3D charts, statistical graphs, and SVG maps. plotly.js is free and open source, and you can view the source, report issues, or contribute on GitHub .
Plotly Studio: Transform any dataset into an interactive data application in minutes with AI. Try Plotly Studio now.
Sign up to stay in the loop with all things Plotly — from Dash Club to product updates, webinars, and more!
Features
- Download Studio
- Javascript (v4.1.1) Python (v7.1.0)
- Javascript (v4.1.1)
- Getting Started
- Is Plotly Free?
- Figure Reference
- Pricing
- Open Source
- Pricing detail
- MIT free core
- Platforms
- JS
Alternatives from our catalog
Tools on the same shelves as Plotly.js, ordered by shared tags and our own comparisons. Not vendor endorsements.
- ApexChartsOpen Source · JS React Vue Angular
Feature-rich interactivity for apps
same tags
- Observable PlotOpen Source · JS
Journalism default for ggplot-like JS
same tags
- NivoOpen Source · React
Design-forward React dashboards
same tags
- visxOpen Source · React
Bespoke React viz composition
same tags
- FlourishFreemium · Web
Non-dev storytelling viz
same tags
- DatawrapperFreemium · Web
Reporter favorite for editorial charts
same tags
Add a badge to your site
Makers listed on isthereanytool.app can embed this badge. It links to Plotly.js’s page on our catalog — no scripts, just HTML.

<a href="https://www.isthereanytool.app/tool/plotly-js" target="_blank" rel="noopener"><img src="https://www.isthereanytool.app/badge/listed.svg?theme=paper" alt="Featured on isthereanytool.app" width="250" height="54"></a>