Tool
Chartbrew
OSS dashboards from DBs and SaaS APIs
About
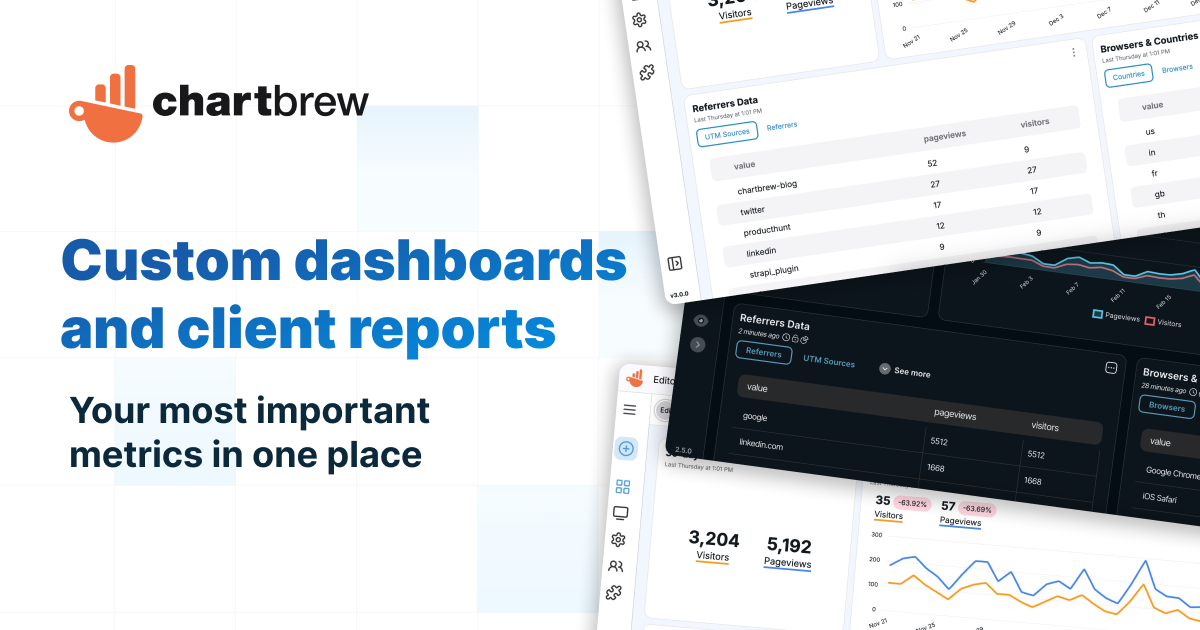
Connect your database or API, build live dashboards for revenue, signups, usage, and team metrics, then share them with the people who need them.
Connect sources, prepare datasets, build dashboards, and keep your reporting workflows moving without adding BI overhead.
Pull in data from databases, APIs, analytics tools, and more, then turn it into dashboards your team can actually use.
Create datasets once, reuse them across charts and dashboards, and join data from multiple sources when needed. Your engineering can also prepare datasets for the rest of the team to use.
Features
- AI SQL Optimizer
- AI MongoDB Query Optimizer
- AI Data Generator
- Service status
- Discord server
- Export to Excel
- Pricing
- Open Source
- Pricing detail
- MIT self-host; cloud
- Platforms
- Web Docker
Alternatives from our catalog
Tools on the same shelves as Chartbrew, ordered by shared tags and our own comparisons. Not vendor endorsements.
- Kepler.glOpen Source · Web
No-code spatial exploration
same tags
- Apache SupersetOpen Source · Web Docker
Self-host BI without Tableau
same tags
- Observable PlotOpen Source · JS
Journalism default for ggplot-like JS
same tags
- NivoOpen Source · React
Design-forward React dashboards
same tags
- GrafanaFreemium · Web Docker
Ops metrics for Prometheus stacks
same tags
- DatawrapperFreemium · Web
Reporter favorite for editorial charts
same tags
Add a badge to your site
Makers listed on isthereanytool.app can embed this badge. It links to Chartbrew’s page on our catalog — no scripts, just HTML.

<a href="https://www.isthereanytool.app/tool/chartbrew" target="_blank" rel="noopener"><img src="https://www.isthereanytool.app/badge/listed.svg?theme=paper" alt="Featured on isthereanytool.app" width="250" height="54"></a>