Tool
Grafana
Observability time-series dashboards
About
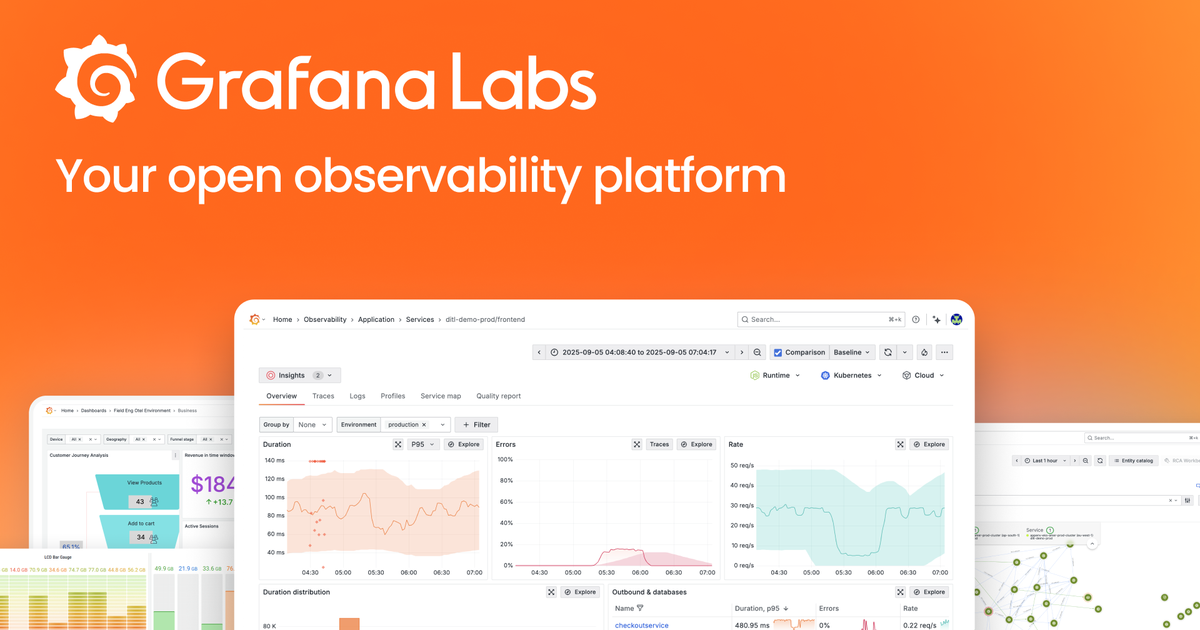
Use Grafana Assistant to understand production telemetry, Investigations to accelerate root cause analysis, and Agent Observability to evaluate and improve production AI agents. All in one OpenTelemetry-native platform.
Half of telemetry spend is wasted. Grafana Cloud’s Adaptive Telemetry suite automatically identifies the data worth your attention and aggregates the rest, cutting your telemetry costs by up to 80%.
Too many tools and data silos? Grafana Cloud unifies telemetry signals into one clear map so your teams can move faster and operate with confidence.
Connect your existing tools and data sources to Grafana Cloud — no rip-and-replace required. Built on open standards like OpenTelemetry and Prometheus, with hundreds of plugins and integrations ready to extend your stack.
Features
- Grafana Cloud
- Pricing
- Freemium
- Pricing detail
- OSS free; Cloud paid
- Platforms
- Web Docker
Alternatives from our catalog
Tools on the same shelves as Grafana, ordered by shared tags and our own comparisons. Not vendor endorsements.
- DatawrapperFreemium · Web
Reporter favorite for editorial charts
same tags
- FlourishFreemium · Web
Non-dev storytelling viz
same tags
- amchartsFreemium · JS
Strong map/stock templates
same tags
- MUI X ChartsFreemium · React MUI
Natural for MUI apps
same tags
- ChartbrewOpen Source · Web Docker
Maker-friendly self-host dashboards
same tags
- Kepler.glOpen Source · Web
No-code spatial exploration
same tags
Add a badge to your site
Makers listed on isthereanytool.app can embed this badge. It links to Grafana’s page on our catalog — no scripts, just HTML.

<a href="https://www.isthereanytool.app/tool/grafana" target="_blank" rel="noopener"><img src="https://www.isthereanytool.app/badge/listed.svg?theme=paper" alt="Featured on isthereanytool.app" width="250" height="54"></a>